


引言:为什么需要理解Kubernetes网络?
想象一下这个场景:你刚刚在Kubernetes集群上部署了你的第一个微服务,从集群内部访问一切正常。但当你想从办公室的电脑直接访问这个服务进行调试时,却发现根本无法连接。这就是典型的“网络孤岛”问题。
本文将一步步带你理解Kubernetes网络的两种核心模式——Overlay和Underlay,并通过大量实际操作,让你不仅能理解概念,还能亲手搭建、观察和调试这些网络。
第一章:环境搭建与基础准备
1.1 完整的实验环境搭建
在开始之前,我们需要一个实验环境。如果你没有现成的Kubernetes集群,可以基于kind搭建测试集群快速创建一个:
配置文件:
kind: ClusterapiVersion: kind.x-k8s.io/v1alpha4networking: apiServerAddress: "10.10.151.201"nodes:- role: control-plane extraPortMappings: - containerPort: 6443 hostPort: 6443 listenAddress: "10.10.151.201" protocol: tcp- role: control-plane- role: control-plane- role: worker- role: worker- role: worker创建高可用集群命令:
sudo kind create cluster --config=huari.yaml --name huari-test --image kindest/node:v1.34.0 --retain; sudo kind export logs --name huari-test切换kubectl上下文:
sudo kubectl cluster-info --context kind-huari-test查看信息:
# 查看集群节点sudo kubectl get nodes
# 查看集群全部的podsudo kubectl get pods -A -owide删除集群:
sudo kind delete cluster --name huari-test1.2 Pod网络基础实验
Kubernetes对网络有两个核心要求,理解这两个要求是理解后续所有内容的基础:
- 每个Pod都有独立IP:每个Pod都拥有一个集群内唯一的IP地址
- Pod间直接通信:任何Pod都可以直接与任何其他Pod通信,无需NAT
让我们创建第一个Pod并观察其网络配置:
# 1、创建一个测试Podkubectl run network-test-pod \ --image=busybox:latest \ --restart=Never \ --labels=app=network-test \ --command -- sh -c "while true; do sleep 3600; done" \ --requests='memory=64Mi,cpu=50m' \ --limits='memory=128Mi,cpu=100m'
# 2、等待Pod就绪kubectl wait --for=condition=ready pod/network-test-pod --timeout=300s
# 3、查看Pod详细信息kubectl get pod network-test-pod -o wide
# 4、Pod内部网络配置kubectl exec network-test-pod -- ip addr showkubectl exec network-test-pod -- cat /etc/resolv.confkubectl exec network-test-pod -- route -n
# 5、Pod网络命名空间信息kubectl exec network-test-pod -- ls -la /proc/self/ns/
# 6、创建Service并测试连通性kubectl expose pod network-test-pod --name=test-service --port=80 --target-port=80
# 7、测试网络连通性-获取信息echo "Service IP: $(kubectl get service test-service -o jsonpath='{.spec.clusterIP}')"echo "Pod IP: $(kubectl get pod network-test-pod -o jsonpath='{.status.podIP}')"
# 8、测试网络连通性-pod内部测试kubectl exec network-test-pod -- sh -c "echo '测试DNS解析...' && nslookup kubernetes.default"kubectl exec network-test-pod -- ping -c 2 8.8.8.8第二章:网络命名空间与veth pair深度解析
2.1 手动创建网络命名空间
找一台linux机器,通过下面一系列命令手动操作网络,理解网络命名空间的工作原理。
# 1. 创建两个网络命名空间sudo ip netns add ns1sudo ip netns add ns2
# 查看所有网络命名空间sudo ip netns list
# 2. 在每个命名空间中查看网络配置sudo ip netns exec ns1 ip addr showsudo ip netns exec ns2 ip addr show
# 3. 创建veth pair连接两个命名空间sudo ip link add veth-ns1 type veth peer name veth-ns2
# 将veth设备移动到对应的命名空间sudo ip link set veth-ns1 netns ns1sudo ip link set veth-ns2 netns ns2
# 4. 配置IP地址并启用接口sudo ip netns exec ns1 ip addr add 10.1.1.1/24 dev veth-ns1sudo ip netns exec ns2 ip addr add 10.1.1.2/24 dev veth-ns2
sudo ip netns exec ns1 ip link set veth-ns1 upsudo ip netns exec ns2 ip link set veth-ns2 up
# 5. 配置回环接口sudo ip netns exec ns1 ip link set lo upsudo ip netns exec ns2 ip link set lo up
# 6. 测试连通性sudo ip netns exec ns1 ping -c 2 10.1.1.2
# 7. 查看路由表sudo ip netns exec ns1 route -nsudo ip netns exec ns2 route -n
# 8. 清理实验环境sudo ip netns del ns1sudo ip netns del ns22.2 可视化:Pod创建过程网络变化
2.3 实际操作:查看真实Pod的veth连接
2.3.1 跳板机执行
# 1、创建测试Podkubectl run network-test-pod \ --image=busybox:latest \ --restart=Never \ --labels=app=network-test \ --command -- sh -c "while true; do sleep 3600; done" \ --requests='memory=64Mi,cpu=50m' \ --limits='memory=128Mi,cpu=100m'
# 2、等待Pod就绪kubectl wait --for=condition=ready pod/network-test-pod --timeout=60s
# 3、获取Pod所在节点NODE_NAME=$(kubectl get pod network-test-pod -o jsonpath='{.spec.nodeName}')echo "Pod所在节点: $NODE_NAME"
# 4、获取pod的容器IDCONTAINER_ID=$(kubectl get pod network-test-pod -o jsonpath='{.status.containerStatuses[0].containerID}' | cut -d'/' -f3)echo "Pod的容器ID: $CONTAINER_ID"
# 5、获取Pod的IP地址POD_IP=$(kubectl get pod network-test-pod -o jsonpath='{.status.podIP}')echo "Pod的IP地址: $POD_IP"
# 6、获取Pod的详细信息kubectl get pod network-test-pod -o yaml | grep -A 10 -B 5 "nodeName\|ip\|containerID"
# 7、查看集群节点网络信息kubectl get nodes -o wide2.3.2 工作节点(手动登录到 $NODE_NAME 节点执行)
# 登录到$NODE_NAME节点docker exec -it $NODE_NAME /bin/bash
# 1、根据容器ID获取容器进程PIDPOD_ID="d1a87c3892e59c78228407df6516a8a64a7fe27ddf912cb8671f025bf5bf2a7c"
if command -v docker &> /dev/null; then PID=$(docker inspect $POD_ID --format '{{.State.Pid}}')else # 使用containerd PID=$(crictl inspect $POD_ID | jq '.info.pid')fiecho "测试pod在宿主机的PID: $PID"
# 2、查看Pod网络命名空间readlink /proc/$PID/ns/net
# 3、查看Pod内部网络接口nsenter -t $PID -n ip -br addr show
# 4、获取容器内eth0的iflink值IFLINK=$(nsenter -t $PID -n cat /sys/class/net/eth0/iflink)echo "主机端veth的ifindex: $IFLINK"
# 5、查找主机端的veth设备# 方法1:通过路由表查找(kind集群通过路由表最可靠)POD_IP=$(nsenter -t $PID -n ip addr show eth0 | grep "inet " | awk '{print $2}' | cut -d/ -f1)VETH_NAME=$(ip route show | grep "$POD_IP dev" | awk '{print $3}')if [ -n "$VETH_NAME" ]; then echo "通过路由表找到的主机端veth设备: $VETH_NAME"else # 方法2:查找所有veth设备,然后通过ifindex匹配 echo "尝试通过ifindex查找..." ip link show type veth | while read line; do if [[ $line =~ ^[0-9]+:[[:space:]]+([^:@]+)@ ]]; then veth=${BASH_REMATCH[1]} peer_ifindex=$(ip -d link show $veth | grep -o "link-netnsid [0-9]*" | awk '{print $2}') if [ "$peer_ifindex" == "$IFLINK" ]; then VETH_NAME=$veth echo "通过ifindex匹配找到的主机端veth设备: $VETH_NAME" fi fi donefi
# 6、查看veth设备的详细信息ip -d link show $VETH_NAME
# 7、查看Pod内部路由表nsenter -t $PID -n ip route
# 8、查看主机路由表(与Pod相关)ip route show | grep -E "(10\.244|$VETH_NAME)"
# 9、查看Pod内部ARP表nsenter -t $PID -n ip neighbor show 2>/dev/null || echo "ARP表为空"
# 10、查看网络连通性GATEWAY=$(nsenter -t $PID -n ip route | grep default | awk '{print $3}')echo "Pod网关: $GATEWAY"
# 11、查看iptables规则(精简版)iptables -t nat -L -n | grep -E "10\.244" | head -5
# 12、查看网络接口统计信息ip -s -br link show $VETH_NAME
# 13、查看CNI配置ls -la /etc/cni/net.d/cat /etc/cni/net.d/*.conflist 2>/dev/null | grep -E "type|name|subnet" | head -10
# 14、查看网络命名空间列表ls -la /var/run/netns/ 2>/dev/null | head -5
# 15、测试网络连通性(使用busybox内置命令)echo "测试Pod到网关的连通性:"nsenter -t $PID -n wget -O- --timeout=2 http://$GATEWAY 2>&1 | head -3 || echo "wget测试失败"
echo "=== 清理命令 ==="echo "# 完成测试后,在主节点执行:"echo "kubectl delete pod network-test-pod"2.3.3 pod创建veth变化总结
-
网络命名空间创建
Pod网络命名空间:net:[4026533548]CNI命名空间文件:/var/run/netns/cni-0d37894c-e435-dbed-0797-9e3390509628- CNI为Pod创建了独立的网络命名空间
- 命名空间ID:4026533548
-
veth pair创建和连接
Pod内部:eth0@if2 (索引2) ←→ 节点内部:vethbcc08328@if3 (索引3)关键信息:
- Pod内eth0接口索引:2
- 主机端veth接口索引:3
- veth pair两端通过if2↔if3标识相互连接
- vethbcc08328连接到Pod的网络命名空间:
cni-0d37894c-e435-dbed-0797-9e3390509628
-
IP地址分配
Pod IP:10.244.5.2/24网关:10.244.5.1- Pod获得IP地址:10.244.5.2
- 子网:10.244.5.0/24
- 默认网关:10.244.5.1(指向主机端veth)
-
路由配置
Pod内部路由:default via 10.244.5.1 dev eth010.244.5.0/24 via 10.244.5.1 dev eth0 src 10.244.5.210.244.5.1 dev eth0 scope link src 10.244.5.2主机路由:10.244.5.2 dev vethbcc08328 scope host ← 最关键!核心路由规则:
- 主机知道如何到达Pod:
10.244.5.2 dev vethbcc08328 - Pod知道如何离开:默认网关指向
10.244.5.1
- 主机知道如何到达Pod:
-
CNI配置确认
CNI类型:ptp (point-to-point)IPAM类型:host-local分配的subnet:10.244.5.0/24- 使用简单的点对点veth连接
- 每个节点分配独立的24位子网
-
veth创建过程的完整时间线
时间线:1. Pod调度到节点 →2. CNI创建网络命名空间 →3. 创建veth pair →4. 一端eth0放入Pod网络命名空间 →5. 另一端vethbcc08328留在主机命名空间 →6. 为eth0分配IP 10.244.5.2 →7. 配置Pod路由表 →8. 添加主机路由:Pod IP → veth设备 →9. Pod网络就绪!
这就是Pod创建过程中veth的真实变化:创建一对虚拟网卡,一端给Pod,一端留在主机,通过路由表将它们连接起来。
第三章:Overlay网络完全解析
3.0 搭建Kind集群
基于kind搭建测试集群快速创建一个可用的测试集群。
配置:
kind: ClusterapiVersion: kind.x-k8s.io/v1alpha4networking: apiServerAddress: "10.10.151.201" disableDefaultCNI: truenodes:- role: control-plane extraPortMappings: - containerPort: 6443 hostPort: 6443 listenAddress: "10.10.151.201" protocol: tcp- role: control-plane- role: control-plane- role: worker- role: worker- role: worker创建高可用集群命令:
sudo kind create cluster --config=huari.yaml --name huari-test --image kindest/node:v1.34.0 --retain; sudo kind export logs --name huari-test切换kubectl上下文:
sudo kubectl cluster-info --context kind-huari-test查看信息:
# 查看集群节点sudo kubectl get nodes
# 查看集群全部的podsudo kubectl get pods -A -owide删除集群:
sudo kind delete cluster --name huari-test3.1 Flannel VXLAN模式部署
# 1. 清理现有网络插件(如果有)kubectl delete daemonset -n kube-flannel kube-flannel-ds --ignore-not-found=truekubectl delete configmap -n kube-flannel kube-flannel-cfg --ignore-not-found=true
# 2. 为kind集群的节点开启依赖的内核模块,并挂载bridge等插件for node in $(kubectl get nodes -o name); do node_name=${node#node/} echo " 准备节点: $node_name"
# 安装CNI插件二进制文件(包括bridge插件) docker exec $node_name sh -c " # 创建必要的目录 mkdir -p /etc/cni/net.d /opt/cni/bin /var/lib/cni
# 如果/opt/cni/bin目录为空,安装CNI插件 if [ ! -f /opt/cni/bin/bridge ] || [ ! -f /opt/cni/bin/flannel ]; then echo '安装CNI插件...' # 下载CNI插件 CNI_VERSION=\"v1.3.0\" ARCH=\"amd64\"
# 检查是否在容器内 if command -v wget >/dev/null 2>&1; then wget -q -O /tmp/cni-plugins.tgz https://github.com/containernetworking/plugins/releases/download/\${CNI_VERSION}/cni-plugins-linux-\${ARCH}-\${CNI_VERSION}.tgz elif command -v curl >/dev/null 2>&1; then curl -sL -o /tmp/cni-plugins.tgz https://github.com/containernetworking/plugins/releases/download/\${CNI_VERSION}/cni-plugins-linux-\${ARCH}-\${CNI_VERSION}.tgz else echo '错误: 需要wget或curl下载CNI插件' exit 1 fi
# 解压CNI插件 tar -xz -C /opt/cni/bin -f /tmp/cni-plugins.tgz rm -f /tmp/cni-plugins.tgz echo 'CNI插件安装完成' fi
# 启用内核模块 modprobe br_netfilter 2>/dev/null || true modprobe vxlan 2>/dev/null || true modprobe bridge 2>/dev/null || true
# 配置网络参数 echo 1 > /proc/sys/net/bridge/bridge-nf-call-iptables 2>/dev/null || true echo 1 > /proc/sys/net/bridge/bridge-nf-call-ip6tables 2>/dev/null || true echo 1 > /proc/sys/net/ipv4/ip_forward 2>/dev/null || true echo 1 > /proc/sys/net/ipv6/conf/all/forwarding 2>/dev/null || true echo 0 > /proc/sys/net/ipv4/conf/all/rp_filter 2>/dev/null || true echo 1 > /proc/sys/net/ipv4/conf/all/arp_filter 2>/dev/null || true
# 检查CNI插件是否安装成功 echo '已安装的CNI插件:' ls -la /opt/cni/bin/ | head -20
# 安装 tcpdump 用于网络调试 echo '安装 tcpdump...' if command -v apt-get >/dev/null 2>&1; then # Debian/Ubuntu 系统 apt-get update >/dev/null 2>&1 apt-get install -y tcpdump >/dev/null 2>&1 && echo 'tcpdump 安装成功' || echo 'tcpdump 安装失败,可能需要手动安装' elif command -v apk >/dev/null 2>&1; then # Alpine 系统 apk add --no-cache tcpdump >/dev/null 2>&1 && echo 'tcpdump 安装成功' || echo 'tcpdump 安装失败,可能需要手动安装' elif command -v yum >/dev/null 2>&1; then # CentOS/RHEL 系统 yum install -y tcpdump >/dev/null 2>&1 && echo 'tcpdump 安装成功' || echo 'tcpdump 安装失败,可能需要手动安装' elif command -v dnf >/dev/null 2>&1; then # Fedora 系统 dnf install -y tcpdump >/dev/null 2>&1 && echo 'tcpdump 安装成功' || echo 'tcpdump 安装失败,可能需要手动安装' else echo '无法确定包管理器,跳过 tcpdump 安装' fi
# 检查tcpdump是否安装成功 echo -n 'tcpdump安装状态: ' if command -v tcpdump >/dev/null 2>&1; then echo '成功 - ' \$(tcpdump --version | head -1) else echo '失败' fi " 2>&1 | sed 's/^/ /'done
# 3. 创建CNI配置文件目录for node in $(kubectl get nodes -o name); do node_name=${node#node/} docker exec $node_name mkdir -p /etc/cni/net.ddone
# 4. 下载Flannel清单文件curl -O https://raw.githubusercontent.com/flannel-io/flannel/master/Documentation/kube-flannel.yml
# 5. 查看并修改Flannel配置配置cat kube-flannel.yml | grep -A 20 "net-conf.json"
# 6. 部署Flannelkubectl apply -f kube-flannel.yml
# 7. 等待Flannel就绪kubectl wait --for=condition=ready pod -l app=flannel -n kube-flannel --timeout=300s
# 8. 查看Flannel部署状态kubectl get pods -n kube-flannel -l app=flannel -o widekubectl get daemonset -n kube-flannel kube-flannel-ds
# 9. 检查Flannel创建的接口for node in $(kubectl get nodes -o name); do node_name=${node#node/} echo -e "\n=== 节点: $node_name ===" docker exec $node_name ip link show | grep -E "(flannel|cni|veth)"done
# 10. 查看Flannel配置kubectl get configmap -n kube-flannel kube-flannel-cfg -o yaml | grep -A 10 "net-conf.json"3.2 VXLAN数据包流转详细分析
以下流程图详细展示了VXLAN模式下数据包的完整流转过程:
3.3 实际抓包分析VXLAN封装
3.3.1 第一阶段:准备测试环境
3.3.1.1 创建测试pod
# 1. 获取节点列表WORKER_NODES=($(kubectl get nodes --selector='!node-role.kubernetes.io/control-plane' -o jsonpath='{.items[*].metadata.name}'))
if [ ${#WORKER_NODES[@]} -lt 2 ]; then echo "错误:需要至少2个工作节点进行跨节点VXLAN测试" echo "当前工作节点数: ${#WORKER_NODES[@]}" exit 1fi
# 选择两个工作节点NODE_A="${WORKER_NODES[0]}"NODE_B="${WORKER_NODES[1]}"echo "节点A: $NODE_A"echo "节点B: $NODE_B"
# 2. 创建测试Pod# 创建Pod A(在节点A)kubectl run vxlan-pod-a \ --image=busybox:latest \ --restart=Never \ --labels=app=vxlan-test \ --overrides="{\"spec\":{\"nodeName\":\"$NODE_A\"}}" \ --command -- sh -c "sleep 3600"
# 创建Pod B(在节点B)kubectl run vxlan-pod-b \ --image=busybox:latest \ --restart=Never \ --labels=app=vxlan-test \ --overrides="{\"spec\":{\"nodeName\":\"$NODE_B\"}}" \ --command -- sh -c "sleep 3600"
# 3. 检查Pod状态kubectl get pods -o wide -l app=vxlan-test
# 4. 获取Pod信息POD_A_IP=$(kubectl get pod vxlan-pod-a -o jsonpath='{.status.podIP}' 2>/dev/null)POD_B_IP=$(kubectl get pod vxlan-pod-b -o jsonpath='{.status.podIP}' 2>/dev/null)POD_A_NODE=$(kubectl get pod vxlan-pod-a -o jsonpath='{.spec.nodeName}' 2>/dev/null)POD_B_NODE=$(kubectl get pod vxlan-pod-b -o jsonpath='{.spec.nodeName}' 2>/dev/null)NODE_A_IP=$(kubectl get node $NODE_A -o jsonpath='{.status.addresses[?(@.type=="InternalIP")].address}')NODE_B_IP=$(kubectl get node $NODE_B -o jsonpath='{.status.addresses[?(@.type=="InternalIP")].address}')
echo "Pod A: $POD_A_IP (节点: $POD_A_NODE; 节点IP: $NODE_A_IP)"echo "Pod B: $POD_B_IP (节点: $POD_B_NODE; 节点IP: $NODE_B_IP)"
# 5、基础网络连通性测试echo "基础连通性测试:"kubectl exec vxlan-pod-a -- ping -c 2 $POD_B_IP
# 6、网络配置检查# 节点A路由表检查docker exec $POD_A_NODE ip route show | grep -E "10.244|flannel|cni0"
# 节点A FDB表检查docker exec $POD_A_NODE bridge fdb show dev flannel.1 | head -53.3.2 第二阶段:多终端抓包分析
3.3.2.1 终端1:持续生成流量
# 0. 前置获取podip信息POD_A_IP=$(kubectl get pod vxlan-pod-a -o jsonpath='{.status.podIP}' 2>/dev/null)POD_B_IP=$(kubectl get pod vxlan-pod-b -o jsonpath='{.status.podIP}' 2>/dev/null)POD_A_NODE=$(kubectl get pod vxlan-pod-a -o jsonpath='{.spec.nodeName}' 2>/dev/null)POD_B_NODE=$(kubectl get pod vxlan-pod-b -o jsonpath='{.spec.nodeName}' 2>/dev/null)
# 1. 先测试一下连通性kubectl exec vxlan-pod-a -- ping -c 2 $POD_B_IP
# 2. 持续生成流量kubectl exec vxlan-pod-a -- ping $POD_B_IP3.3.2.2 终端2:顺序抓包分析
前置获取podip信息
# 0. 前置获取podip信息POD_A_IP=$(kubectl get pod vxlan-pod-a -o jsonpath='{.status.podIP}' 2>/dev/null)POD_B_IP=$(kubectl get pod vxlan-pod-b -o jsonpath='{.status.podIP}' 2>/dev/null)POD_A_NODE=$(kubectl get pod vxlan-pod-a -o jsonpath='{.spec.nodeName}' 2>/dev/null)POD_B_NODE=$(kubectl get pod vxlan-pod-b -o jsonpath='{.spec.nodeName}' 2>/dev/null)在Pod A内部抓取原始数据包:
# kubectl debug pod/vxlan-pod-a -it --image=nicolaka/netshoot -- tcpdump -i eth0 -nn -c 3 "icmp"--profile=legacy is deprecated and will be removed in the future. It is recommended to explicitly specify a profile, for example "--profile=general".Defaulting debug container name to debugger-sthg8.All commands and output from this session will be recorded in container logs, including credentials and sensitive information passed through the command prompt.If you don't see a command prompt, try pressing enter.03:27:35.512446 IP 10.244.6.7 > 10.244.3.7: ICMP echo request, id 26, seq 151, length 6403:27:35.512653 IP 10.244.3.7 > 10.244.6.7: ICMP echo reply, id 26, seq 151, length 6403:27:36.512793 IP 10.244.6.7 > 10.244.3.7: ICMP echo request, id 26, seq 152, length 643 packets captured4 packets received by filter0 packets dropped by kernel在节点A的cni0网桥抓包:
# docker exec $POD_A_NODE tcpdump -i cni0 -nn -c 3 "icmp"tcpdump: verbose output suppressed, use -v[v]... for full protocol decodelistening on cni0, link-type EN10MB (Ethernet), snapshot length 262144 bytes3 packets captured4 packets received by filter0 packets dropped by kernel03:29:04.542136 IP 10.244.6.7 > 10.244.3.7: ICMP echo request, id 26, seq 240, length 6403:29:04.542350 IP 10.244.3.7 > 10.244.6.7: ICMP echo reply, id 26, seq 240, length 6403:29:05.542482 IP 10.244.6.7 > 10.244.3.7: ICMP echo request, id 26, seq 241, length 64在节点A的flannel.1接口抓包:
# docker exec $POD_A_NODE tcpdump -i flannel.1 -nn -c 3 -vtcpdump: listening on flannel.1, link-type EN10MB (Ethernet), snapshot length 262144 bytes3 packets captured4 packets received by filter0 packets dropped by kernel03:29:17.546379 IP (tos 0x0, ttl 63, id 33583, offset 0, flags [DF], proto ICMP (1), length 84) 10.244.6.7 > 10.244.3.7: ICMP echo request, id 26, seq 253, length 6403:29:17.546550 IP (tos 0x0, ttl 63, id 8786, offset 0, flags [none], proto ICMP (1), length 84) 10.244.3.7 > 10.244.6.7: ICMP echo reply, id 26, seq 253, length 6403:29:18.546701 IP (tos 0x0, ttl 63, id 34283, offset 0, flags [DF], proto ICMP (1), length 84) 10.244.6.7 > 10.244.3.7: ICMP echo request, id 26, seq 254, length 64在节点A的物理网卡抓取VXLAN UDP包:
# docker exec $POD_A_NODE tcpdump -i eth0 udp port 8472 -nn -c 3 -vtcpdump: listening on eth0, link-type EN10MB (Ethernet), snapshot length 262144 bytes3 packets captured4 packets received by filter0 packets dropped by kernel03:29:30.550964 IP (tos 0x0, ttl 64, id 58278, offset 0, flags [none], proto UDP (17), length 134) 172.18.0.6.46295 > 172.18.0.5.8472: OTV, flags [I] (0x08), overlay 0, instance 1IP (tos 0x0, ttl 63, id 41702, offset 0, flags [DF], proto ICMP (1), length 84) 10.244.6.7 > 10.244.3.7: ICMP echo request, id 26, seq 266, length 6403:29:30.551101 IP (tos 0x0, ttl 64, id 40100, offset 0, flags [none], proto UDP (17), length 134) 172.18.0.5.46295 > 172.18.0.6.8472: OTV, flags [I] (0x08), overlay 0, instance 1IP (tos 0x0, ttl 63, id 16211, offset 0, flags [none], proto ICMP (1), length 84) 10.244.3.7 > 10.244.6.7: ICMP echo reply, id 26, seq 266, length 6403:29:31.551338 IP (tos 0x0, ttl 64, id 59149, offset 0, flags [none], proto UDP (17), length 134) 172.18.0.6.46295 > 172.18.0.5.8472: OTV, flags [I] (0x08), overlay 0, instance 1IP (tos 0x0, ttl 63, id 42397, offset 0, flags [DF], proto ICMP (1), length 84) 10.244.6.7 > 10.244.3.7: ICMP echo request, id 26, seq 267, length 64在节点B的物理网卡抓取接收的VXLAN包:
# docker exec $POD_B_NODE tcpdump -i eth0 udp port 8472 -nn -c 3 -vtcpdump: listening on eth0, link-type EN10MB (Ethernet), snapshot length 262144 bytes3 packets captured4 packets received by filter0 packets dropped by kernel03:29:50.557797 IP (tos 0x0, ttl 64, id 4465, offset 0, flags [none], proto UDP (17), length 134) 172.18.0.6.46295 > 172.18.0.5.8472: OTV, flags [I] (0x08), overlay 0, instance 1IP (tos 0x0, ttl 63, id 51882, offset 0, flags [DF], proto ICMP (1), length 84) 10.244.6.7 > 10.244.3.7: ICMP echo request, id 26, seq 286, length 6403:29:50.557885 IP (tos 0x0, ttl 64, id 50442, offset 0, flags [none], proto UDP (17), length 134) 172.18.0.5.46295 > 172.18.0.6.8472: OTV, flags [I] (0x08), overlay 0, instance 1IP (tos 0x0, ttl 63, id 24693, offset 0, flags [none], proto ICMP (1), length 84) 10.244.3.7 > 10.244.6.7: ICMP echo reply, id 26, seq 286, length 6403:29:51.558130 IP (tos 0x0, ttl 64, id 5045, offset 0, flags [none], proto UDP (17), length 134) 172.18.0.6.46295 > 172.18.0.5.8472: OTV, flags [I] (0x08), overlay 0, instance 1IP (tos 0x0, ttl 63, id 51948, offset 0, flags [DF], proto ICMP (1), length 84) 10.244.6.7 > 10.244.3.7: ICMP echo request, id 26, seq 287, length 64在节点B的flannel.1接口抓包:
# docker exec $POD_B_NODE tcpdump -i flannel.1 -nn -c 3 "icmp"tcpdump: verbose output suppressed, use -v[v]... for full protocol decodelistening on flannel.1, link-type EN10MB (Ethernet), snapshot length 262144 bytes3 packets captured4 packets received by filter0 packets dropped by kernel03:31:46.597478 IP 10.244.6.7 > 10.244.3.7: ICMP echo request, id 26, seq 402, length 6403:31:46.597528 IP 10.244.3.7 > 10.244.6.7: ICMP echo reply, id 26, seq 402, length 6403:31:47.597830 IP 10.244.6.7 > 10.244.3.7: ICMP echo request, id 26, seq 403, length 64在节点B的cni0网桥抓包:
# docker exec $POD_B_NODE tcpdump -i cni0 -nn -c 3 "icmp"tcpdump: verbose output suppressed, use -v[v]... for full protocol decodelistening on cni0, link-type EN10MB (Ethernet), snapshot length 262144 bytes3 packets captured4 packets received by filter0 packets dropped by kernel03:32:45.617538 IP 10.244.6.7 > 10.244.3.7: ICMP echo request, id 26, seq 461, length 6403:32:45.617571 IP 10.244.3.7 > 10.244.6.7: ICMP echo reply, id 26, seq 461, length 6403:32:46.617902 IP 10.244.6.7 > 10.244.3.7: ICMP echo request, id 26, seq 462, length 64在Pod B内部抓取接收的数据包:
# kubectl debug pod/vxlan-pod-b -it --image=nicolaka/netshoot -- tcpdump -i eth0 -nn -c 3 "icmp"--profile=legacy is deprecated and will be removed in the future. It is recommended to explicitly specify a profile, for example "--profile=general".Defaulting debug container name to debugger-dv95v.All commands and output from this session will be recorded in container logs, including credentials and sensitive information passed through the command prompt.If you don't see a command prompt, try pressing enter.03:33:59.643009 IP 10.244.6.7 > 10.244.3.7: ICMP echo request, id 26, seq 535, length 643 packets captured4 packets received by filter0 packets dropped by kernel3.3.3 Flannel VXLAN流量全路径抓包分析
3.3.3.1 环境信息
- Pod网络:
10.244.0.0/16- Pod A:
10.244.6.7(节点A) - Pod B:
10.244.3.7(节点B)
- Pod A:
- 节点网络:
172.18.0.0/16- 节点A:
172.18.0.6 - 节点B:
172.18.0.5
- 节点A:
- VXLAN参数: UDP端口8472, VNI=1
3.3.3.2 阶段一:Pod A内部 - 原始报文生成
# Pod A内部抓包结果03:27:35.512446 IP 10.244.6.7 > 10.244.3.7: ICMP echo request, id 26, seq 151, length 64📊 详细分析:
-
源IP:
10.244.6.7(Pod A的IP) -
目的IP:
10.244.3.7(Pod B的IP) -
协议: ICMP (ping请求)
-
TTL: 默认64(从应用层发出)
-
数据链路层: 源MAC为Pod A的eth0 MAC (
02:42:0a:f4:06:07),目的MAC为Pod A的默认网关MAC(即cni0网桥的MAC) -
MAC地址生成规则参考: 02:42:<IP地址的十六进制表示>
✅ 验证点: 这是通信的绝对起点,应用程序发起对目标Pod的访问。
3.3.3.3 阶段二:节点A cni0网桥 - 网桥接收与转发
bash
# 节点A cni0网桥抓包03:29:04.542136 IP 10.244.6.7 > 10.244.3.7: ICMP echo request, id 26, seq 240, length 64📊 详细分析:
- 路径: Pod A的eth0 ↔ veth pair (一端在Pod内,一端在主机) → cni0网桥
- 报文状态: IP头部无变化,仍为原始ICMP包
- MAC地址转换:
- 在cni0网桥处,源MAC已变为veth端口的MAC
- 目的MAC变为flannel.1设备的MAC(通过ARP查询获得)
- 网桥学习: cni0网桥学习到
10.244.6.7对应的MAC地址与veth端口的映射关系
✅ 验证点: 数据包已从Pod网络命名空间进入主机网络命名空间,准备进行三层路由。
3.3.3.4 阶段三:节点A flannel.1接口 - 路由决策与VXLAN准备
# 节点A flannel.1接口抓包03:29:17.546379 IP (tos 0x0, ttl 63, id 33583, offset 0, flags [DF], proto ICMP (1), length 84) 10.244.6.7 > 10.244.3.7: ICMP echo request, id 26, seq 253, length 64📊 详细分析:
-
TTL变化:
64 → 63,减少了1-
原因: 数据包经过了一次路由跳转(从cni0到flannel.1)
-
路由表验证:
# 在节点A执行# docker exec $POD_A_NODE ip route show | grep 10.244.3.010.244.3.0/24 via 10.244.3.0 dev flannel.1 onlink
-
-
内核路由流程:
1. 目标IP 10.244.3.7 匹配到路由规则: 10.244.3.0/24 via 10.244.3.0 dev flannel.12. 查询ARP表获取10.244.3.0对应的MAC地址(即flannel.1的MAC)3. 数据包进入flannel.1设备,准备VXLAN封装 -
FDB表查询:
# 节点A上验证FDB表# docker exec $POD_A_NODE bridge fdb show dev flannel.1a6:84:3c:26:82:05 dst 172.18.0.8 self permanentda:45:63:55:cc:8a dst 172.18.0.4 self permanent56:ad:95:b2:68:dd dst 172.18.0.7 self permanent8e:38:6d:05:49:ed dst 172.18.0.5 self permanent1a:ad:49:e1:4d:a3 dst 172.18.0.3 self permanent# 应包含: dst 172.18.0.5 self permanent (节点B的物理IP)
✅ 验证点: 数据包经过了一次路由跳转,进入VXLAN隧道设备,TTL减1。
3.3.3.5 阶段四:节点A物理网卡 - VXLAN封装与发送
# 节点A物理网卡抓包 (eth0)03:29:30.550964 IP (tos 0x0, ttl 64, id 58278, offset 0, flags [none], proto UDP (17), length 134) 172.18.0.6.46295 > 172.18.0.5.8472: OTV, flags [I] (0x08), overlay 0, instance 1IP (tos 0x0, ttl 63, id 41702, offset 0, flags [DF], proto ICMP (1), length 84) 10.244.6.7 > 10.244.3.7: ICMP echo request, id 26, seq 266, length 64📊 详细分析:
🔶 外层封装(隧道头部):
- 外层以太网帧:
- 源MAC: 节点A物理网卡MAC
- 目的MAC: 节点B物理网卡MAC(通过ARP查询
172.18.0.5获得)
- 外层IP头部:
- 源IP:
172.18.0.6(节点A物理IP) - 目的IP:
172.18.0.5(节点B物理IP) - TTL: 64(重新开始计数)
- 协议: UDP (17)
- 源IP:
- UDP头部:
- 源端口:
46295(随机高端口) - 目的端口:
8472(Flannel VXLAN标准端口) - 长度: 134字节
- 源端口:
- VXLAN头部:
- Flags:
[I] (0x08)(有效数据标志) - VNI:
instance 1(对应VXLAN头部的VNI=1字段) - Reserved字段:
overlay 0
- Flags:
🔶 内层封装(原始数据包):
- 完整保留了原始ICMP包,包括:
- 源IP:
10.244.6.7(Pod A) - 目的IP:
10.244.3.7(Pod B) - TTL: 63(从flannel.1出来的值)
- ICMP序列号: 266
- 源IP:
🔶 封装过程:
原始ICMP包 (84字节)↓VXLAN封装├─ VXLAN头部 (8字节)├─ UDP头部 (8字节)├─ 外层IP头部 (20字节)├─ 外层以太网头部 (14字节)↓总长度: 84 + 8 + 8 + 20 + 14 = 134字节✅ 验证点: VXLAN封装成功完成,原始Pod间通信被完整封装在隧道内。
3.3.3.6 阶段五:节点B物理网卡 - VXLAN接收
# 节点B物理网卡抓包03:29:50.557797 IP (tos 0x0, ttl 64, id 4465, offset 0, flags [none], proto UDP (17), length 134) 172.18.0.6.46295 > 172.18.0.5.8472: OTV, flags [I] (0x08), overlay 0, instance 1IP (tos 0x0, ttl 63, id 51882, offset 0, flags [DF], proto ICMP (1), length 84) 10.244.6.7 > 10.244.3.7: ICMP echo request, id 26, seq 286, length 64📊 详细分析:
-
物理网络传输:
- 底层交换机根据外层目的MAC (
52:54:00:bb:bb:bb) 转发到节点B - 外层TTL从64减少到64(同网段,未经过路由器)
- 底层交换机根据外层目的MAC (
-
内核处理:
- 节点B的eth0收到UDP包,检查目的端口为
8472 - 识别为VXLAN包,触发VXLAN内核模块处理
- 验证VNI=1,确认属于Flannel网络
- 节点B的eth0收到UDP包,检查目的端口为
-
逆向学习:
# 节点B会学习源VTEP信息# docker exec $POD_B_NODE bridge fdb show dev flannel.1a6:84:3c:26:82:05 dst 172.18.0.8 self permanentda:45:63:55:cc:8a dst 172.18.0.4 self permanent56:ad:95:b2:68:dd dst 172.18.0.7 self permanentbe:72:bc:c3:f0:9e dst 172.18.0.6 self permanent1a:ad:49:e1:4d:a3 dst 172.18.0.3 self permanent
✅ 验证点: VXLAN隧道包成功跨越物理网络到达目标节点。
3.3.3.7 阶段六:节点B flannel.1接口 - VXLAN解封装
# 节点B flannel.1接口抓包03:31:46.597478 IP 10.244.6.7 > 10.244.3.7: ICMP echo request, id 26, seq 402, length 64📊 详细分析:
-
解封装过程:
收到VXLAN包 → 剥离外层头部 → 恢复原始IP包└─ 移除: 外层以太网头(14B)、外层IP头(20B)、UDP头(8B)、VXLAN头(8B)└─ 保留: 原始IP包(84B) -
报文状态:
- 源/目的IP: 保持不变
- TTL: 仍为63(解封装不影响TTL)
- ICMP序列号: 402
-
路由决策:
# 节点B路由表查询# docker exec $POD_B_NODE ip route show | grep 10.244.3.010.244.3.0/24 dev cni0 proto kernel scope link src 10.244.3.1 linkdown- 目标IP
10.244.3.7匹配本地cni0网桥的路由 - 准备进行二层转发
- 目标IP
✅ 验证点: VXLAN解封装成功,恢复出原始Pod间通信包。
3.3.3.8 阶段七:节点B cni0网桥 - 本地转发
# 节点B cni0网桥抓包03:32:45.617538 IP 10.244.6.7 > 10.244.3.7: ICMP echo request, id 26, seq 461, length 64📊 详细分析:
- MAC地址转换:
- 源MAC: 变为cni0网桥的MAC
- 目的MAC: 变为Pod B的eth0 MAC(通过ARP表查询
10.244.3.7获得)
- 网桥转发:
- cni0根据目的MAC查找MAC地址表
- 找到对应的veth接口
vethyyyy - 将帧转发到veth pair
✅ 验证点: 数据包在目标节点内部完成二层转发。
3.3.3.9 阶段八:Pod B内部 - 最终接收
# Pod B内部抓包03:33:59.643009 IP 10.244.6.7 > 10.244.3.7: ICMP echo request, id 26, seq 535, length 64📊 详细分析:
-
完整路径总结:
Pod A eth0 (10.244.6.7)↓ veth pair↓ cni0网桥 (节点A)↓ 路由决策↓ flannel.1 VXLAN设备↓ VXLAN封装↓ 物理网卡eth0 (172.18.0.6)↓ 物理网络传输↓ 物理网卡eth0 (172.18.0.5)↓ VXLAN解封装↓ flannel.1设备 (节点B)↓ 路由决策↓ cni0网桥 (节点B)↓ veth pair↓ Pod B eth0 (10.244.3.7) -
端到端验证:
- IP地址: 源/目的IP全程保持不变
- TTL变化: 64 → 63 → 63 → 交付应用
- 数据完整性: ICMP序列号递增,无丢包
- 封装开销: 原始84字节ICMP包,封装后134字节,增加了50字节头部
✅ 验证点: 跨节点Pod通信成功,全路径各环节均工作正常。
第四章:Underlay网络完全解析
4.0搭建Kind集群
基于kind搭建测试集群快速创建一个可用的测试集群。
配置:
kind: ClusterapiVersion: kind.x-k8s.io/v1alpha4networking: apiServerAddress: "10.10.151.201" disableDefaultCNI: true podSubnet: "192.168.0.0/16"nodes:- role: control-plane extraPortMappings: - containerPort: 6443 hostPort: 6443 listenAddress: "10.10.151.201" protocol: tcp- role: control-plane- role: control-plane- role: worker- role: worker- role: worker创建高可用集群命令:
sudo kind create cluster --config=huari.yaml --name huari-test --image kindest/node:v1.34.0 --retain; sudo kind export logs --name huari-test切换kubectl上下文:
sudo kubectl cluster-info --context kind-huari-test查看信息:
# 查看集群节点sudo kubectl get nodes
# 查看集群全部的podsudo kubectl get pods -A -owide删除集群:
sudo kind delete cluster --name huari-test4.1 部署 Calico
# 1. 清理Flannel(如果已安装)kubectl delete -f kube-flannel.yml --ignore-not-found=true
# 2. 下载Calico清单文件curl -L https://raw.githubusercontent.com/projectcalico/calico/v3.27.0/manifests/calico.yaml -o calico.yaml
# 3. 修改Calico配置为BGP模式(禁用IPIP)sed -i 's|192.168.0.0/16|10.244.0.0/16|g' calico.yamlsed -i '/name: CALICO_IPV4POOL_IPIP/{n;s/value: ".*"/value: "Never"/}' calico.yamlsed -i '/name: CALICO_IPV4POOL_VXLAN/{n;s/value: ".*"/value: "Never"/}' calico.yamlsed -i '/name: FELIX_IPV6SUPPORT/{n;s/value: "true"/value: "false"/}' calico.yamlsed -i '/name: IP_AUTODETECTION_METHOD/,+1d' calico.yamlsed -i '/name: IP/{n;s/value: ".*"/value: "autodetect"/}' calico.yamlsed -i '/name: IP/{n;s/.*/&\n - name: IP_AUTODETECTION_METHOD\n value: "first-found"/}' calico.yamlsed -i '/name: IP_AUTODETECTION_METHOD/a\ - name: BGP_LOGSEVERITYSCREEN\n value: "info"' calico.yaml
# 4. 部署Calicokubectl apply -f calico.yaml
# 5. 等待Calico就绪kubectl wait --for=condition=ready pod -l k8s-app=calico-node -n kube-system --timeout=300s
# 6. 检查Calico部署状态kubectl get pods -n kube-system -l k8s-app=calico-node -o widekubectl get daemonset -n kube-system calico-node
# 7. 安装calicoctlcurl -L https://github.com/projectcalico/calico/releases/download/v3.27.0/calicoctl-linux-amd64 -o calicoctl-linux-amd64chmod +x calicoctl-linux-amd64sudo mv calicoctl-linux-amd64 /usr/local/bin/calicoctl
# 8. 配置calicoctlecho 'export DATASTORE_TYPE=kubernetes' >> ~/.bashrcecho 'export KUBECONFIG=/root/.kube/config' >> ~/.bashrcsource ~/.bashrc
# 9. 检查BGP状态calicoctl get nodes# 客户端中硬编码了 BIRD socket 路径(/var/run/bird/bird.ctl),所以可能会遇见报错。但这个报错可以忽略,不影响 Calico 的实际功能。calicoctl node status
# 10. 查看IP池配置echo -e "\n9. 查看IP池配置:"calicoctl get ippools -o yaml
# 11. 检查网络接口for node in $(kubectl get nodes -o name); do node_name=${node#node/} echo -e "\n=== 节点: $node_name ===" docker exec $node_name ip link show | grep -E "(cali|wireguard|tunl)" echo "路由表:" docker exec $node_name ip route show | grep -E "(bird|calico|10\.244)"done4.2 BGP路由过程详细分析
4.3 BGP网络验证与测试
4.3.1 第一阶段:准备测试环境
4.3.1.1 获取节点信息并创建测试Pod
# 1. 获取节点列表WORKER_NODES=($(kubectl get nodes --selector='!node-role.kubernetes.io/control-plane' -o jsonpath='{.items[*].metadata.name}'))
if [ ${#WORKER_NODES[@]} -lt 2 ]; then echo "错误:需要至少2个工作节点进行跨节点BGP测试" echo "当前工作节点数: ${#WORKER_NODES[@]}" exit 1fi
# 选择两个工作节点NODE_A="${WORKER_NODES[0]}"NODE_B="${WORKER_NODES[1]}"echo "节点A: $NODE_A"echo "节点B: $NODE_B"
# 2. 创建测试Pod# 创建Pod A(在节点A)kubectl run bgp-test-a \ --image=busybox:latest \ --restart=Never \ --labels=app=bgp-test \ --overrides="{\"spec\":{\"nodeName\":\"$NODE_A\"}}" \ --command -- sh -c "sleep 3600"
# 创建Pod B(在节点B)kubectl run bgp-test-b \ --image=busybox:latest \ --restart=Never \ --labels=app=bgp-test \ --overrides="{\"spec\":{\"nodeName\":\"$NODE_B\"}}" \ --command -- sh -c "sleep 3600"
# 3. 检查Pod状态kubectl get pods -o wide -l app=bgp-test
# 4. 获取Pod信息POD_A_IP=$(kubectl get pod bgp-test-a -o jsonpath='{.status.podIP}' 2>/dev/null)POD_B_IP=$(kubectl get pod bgp-test-b -o jsonpath='{.status.podIP}' 2>/dev/null)POD_A_NODE=$(kubectl get pod bgp-test-a -o jsonpath='{.spec.nodeName}' 2>/dev/null)POD_B_NODE=$(kubectl get pod bgp-test-b -o jsonpath='{.spec.nodeName}' 2>/dev/null)NODE_A_IP=$(kubectl get node $NODE_A -o jsonpath='{.status.addresses[?(@.type=="InternalIP")].address}')NODE_B_IP=$(kubectl get node $NODE_B -o jsonpath='{.status.addresses[?(@.type=="InternalIP")].address}')
echo "Pod A: $POD_A_IP (节点: $POD_A_NODE; 节点IP: $NODE_A_IP)"echo "Pod B: $POD_B_IP (节点: $POD_B_NODE; 节点IP: $NODE_B_IP)"
# 5、基础网络连通性测试echo "基础连通性测试:"kubectl exec bgp-test-a -- ping -c 2 $POD_B_IP
# 6、网络配置检查# 节点A路由表检查docker exec $POD_A_NODE ip route show | grep -E "192.168|bird|calico"4.3.1.2 节点安装依赖工具
for node in $(kubectl get nodes -o name); do node_name=${node#node/} echo " 准备节点: $node_name"
# 安装CNI插件二进制文件(包括bridge插件) docker exec $node_name sh -c " # 安装 tcpdump 用于网络调试 echo '安装 tcpdump...' if command -v apt-get >/dev/null 2>&1; then # Debian/Ubuntu 系统 apt-get update >/dev/null 2>&1 apt-get install -y tcpdump >/dev/null 2>&1 && echo 'tcpdump 安装成功' || echo 'tcpdump 安装失败,可能需要手动安装' elif command -v apk >/dev/null 2>&1; then # Alpine 系统 apk add --no-cache tcpdump >/dev/null 2>&1 && echo 'tcpdump 安装成功' || echo 'tcpdump 安装失败,可能需要手动安装' elif command -v yum >/dev/null 2>&1; then # CentOS/RHEL 系统 yum install -y tcpdump >/dev/null 2>&1 && echo 'tcpdump 安装成功' || echo 'tcpdump 安装失败,可能需要手动安装' elif command -v dnf >/dev/null 2>&1; then # Fedora 系统 dnf install -y tcpdump >/dev/null 2>&1 && echo 'tcpdump 安装成功' || echo 'tcpdump 安装失败,可能需要手动安装' else echo '无法确定包管理器,跳过 tcpdump 安装' fi
# 检查tcpdump是否安装成功 echo -n 'tcpdump安装状态: ' if command -v tcpdump >/dev/null 2>&1; then echo '成功 - ' \$(tcpdump --version | head -1) else echo '失败' fi " 2>&1 | sed 's/^/ /'done4.3.2 第二阶段:多终端验证分析
4.3.2.1 终端1:持续生成流量
# 0. 前置获取podip信息POD_A_IP=$(kubectl get pod bgp-test-a -o jsonpath='{.status.podIP}' 2>/dev/null)POD_B_IP=$(kubectl get pod bgp-test-b -o jsonpath='{.status.podIP}' 2>/dev/null)POD_A_NODE=$(kubectl get pod bgp-test-a -o jsonpath='{.spec.nodeName}' 2>/dev/null)POD_B_NODE=$(kubectl get pod bgp-test-b -o jsonpath='{.spec.nodeName}' 2>/dev/null)NODE_A_IP=$(kubectl get node $NODE_A -o jsonpath='{.status.addresses[?(@.type=="InternalIP")].address}')NODE_B_IP=$(kubectl get node $NODE_B -o jsonpath='{.status.addresses[?(@.type=="InternalIP")].address}')
# 1. 先测试一下连通性kubectl exec bgp-test-a -- ping -c 2 $POD_B_IP
# 2. 持续生成流量kubectl exec bgp-test-a -- ping $POD_B_IP4.3.2.2 终端2:抓包验证无封装
前置获取podip信息
# 0. 前置获取podip信息WORKER_NODES=($(kubectl get nodes --selector='!node-role.kubernetes.io/control-plane' -o jsonpath='{.items[*].metadata.name}'))
if [ ${#WORKER_NODES[@]} -lt 2 ]; then echo "错误:需要至少2个工作节点进行跨节点BGP测试" echo "当前工作节点数: ${#WORKER_NODES[@]}" exit 1fi
# 选择两个工作节点NODE_A="${WORKER_NODES[0]}"NODE_B="${WORKER_NODES[1]}"POD_A_IP=$(kubectl get pod bgp-test-a -o jsonpath='{.status.podIP}' 2>/dev/null)POD_B_IP=$(kubectl get pod bgp-test-b -o jsonpath='{.status.podIP}' 2>/dev/null)POD_A_NODE=$(kubectl get pod bgp-test-a -o jsonpath='{.spec.nodeName}' 2>/dev/null)POD_B_NODE=$(kubectl get pod bgp-test-b -o jsonpath='{.spec.nodeName}' 2>/dev/null)NODE_A_IP=$(kubectl get node $NODE_A -o jsonpath='{.status.addresses[?(@.type=="InternalIP")].address}')NODE_B_IP=$(kubectl get node $NODE_B -o jsonpath='{.status.addresses[?(@.type=="InternalIP")].address}')在Pod A内部抓取原始数据包:
# kubectl debug pod/bgp-test-a -it --image=nicolaka/netshoot -- tcpdump -i eth0 -nn -c 3 "icmp"--profile=legacy is deprecated and will be removed in the future. It is recommended to explicitly specify a profile, for example "--profile=general".Defaulting debug container name to debugger-52gfw.All commands and output from this session will be recorded in container logs, including credentials and sensitive information passed through the command prompt.If you don't see a command prompt, try pressing enter.06:02:26.698382 IP 192.168.252.6 > 192.168.114.66: ICMP echo request, id 14, seq 24, length 6406:02:26.698545 IP 192.168.114.66 > 192.168.252.6: ICMP echo reply, id 14, seq 24, length 6406:02:27.698671 IP 192.168.252.6 > 192.168.114.66: ICMP echo request, id 14, seq 25, length 643 packets captured4 packets received by filter0 packets dropped by kernel获取Pod A对应的cali接口名称(通过iflink索引)
# IFLINK=$(kubectl exec bgp-test-a -- cat /sys/class/net/eth0/iflink)Defaulted container "bgp-test-a" out of: bgp-test-a, debugger-52gfw (ephem)# CALI_A=$(docker exec $POD_A_NODE ip -o link show | grep "^${IFLINK}:" | awk '{print $2}' | sed 's/://')# echo "Pod A对应的cali接口: $CALI_A"Pod A对应的cali接口: cali2c3211ffbd5在节点A的cali接口抓包
# docker exec $POD_A_NODE tcpdump -i $CALI_A -nn -c 3 "icmp"tcpdump: verbose output suppressed, use -v[v]... for full protocol decodelistening on cali2c3211ffbd5, link-type EN10MB (Ethernet), snapshot length 262144 bytes08:57:55.179227 IP 192.168.252.7 > 192.168.114.67: ICMP echo request, id 14, seq 102, length 6408:57:55.179385 IP 192.168.114.67 > 192.168.252.7: ICMP echo reply, id 14, seq 102, length 6408:57:56.179458 IP 192.168.252.7 > 192.168.114.67: ICMP echo request, id 14, seq 103, length 643 packets captured4 packets received by filter0 packets dropped by kernel检查节点A的路由表,确认下一跳
由于BGP通告的是子网路由,而非单个主机路由,因此应查看与Pod B IP匹配的子网条目:
# docker exec $POD_A_NODE ip route show | grep -E "$(echo $POD_B_IP | cut -d. -f1-3)"192.168.114.64/26 via 172.18.0.8 dev eth0 proto bird其中 172.18.0.8 为节点B的物理IP。这证明BGP路由已正确安装,目标子网 192.168.114.64/26 的下一跳指向节点B.
在节点A的物理网卡eth0上抓包(验证无封装)
# docker exec $POD_A_NODE tcpdump -i eth0 -nn icmp and host $POD_B_IP -c 3 -vtcpdump: listening on eth0, link-type EN10MB (Ethernet), snapshot length 262144 bytes3 packets captured4 packets received by filter0 packets dropped by kernel09:07:10.329848 IP (tos 0x0, ttl 63, id 1812, offset 0, flags [DF], proto ICMP (1), length 84) 192.168.252.7 > 192.168.114.67: ICMP echo request, id 14, seq 657, length 6409:07:10.329946 IP (tos 0x0, ttl 63, id 8769, offset 0, flags [none], proto ICMP (1), length 84) 192.168.114.67 > 192.168.252.7: ICMP echo reply, id 14, seq 657, length 6409:07:11.330101 IP (tos 0x0, ttl 63, id 1876, offset 0, flags [DF], proto ICMP (1), length 84) 192.168.252.7 > 192.168.114.67: ICMP echo request, id 14, seq 658, length 64关键验证:物理网络上直接传输Pod IP,无任何隧道封装头部(如VXLAN/IPIP)。
在节点B的物理网卡eth0上抓包
# docker exec $POD_B_NODE tcpdump -i eth0 -nn icmp and host $POD_B_IP -c 3 -vtcpdump: listening on eth0, link-type EN10MB (Ethernet), snapshot length 262144 bytes3 packets captured4 packets received by filter0 packets dropped by kernel09:08:00.343503 IP (tos 0x0, ttl 63, id 26778, offset 0, flags [DF], proto ICMP (1), length 84) 192.168.252.7 > 192.168.114.67: ICMP echo request, id 14, seq 707, length 6409:08:00.343569 IP (tos 0x0, ttl 63, id 33457, offset 0, flags [none], proto ICMP (1), length 84) 192.168.114.67 > 192.168.252.7: ICMP echo reply, id 14, seq 707, length 6409:08:01.343761 IP (tos 0x0, ttl 63, id 27568, offset 0, flags [DF], proto ICMP (1), length 84) 192.168.252.7 > 192.168.114.67: ICMP echo request, id 14, seq 708, length 64数据包已到达节点B,且未封装。
获取Pod B对应的cali接口名称(同样去除@后缀)
# IFLINK_B=$(kubectl exec bgp-test-b -- cat /sys/class/net/eth0/iflink)# CALI_B=$(docker exec $POD_B_NODE ip -o link show | grep "^${IFLINK_B}:" | awk '{print $2}' | sed 's/://' | sed 's/@.*//')# echo "Pod B对应的cali接口: $CALI_B"Pod B对应的cali接口: cali60e949dde20在节点B的cali接口抓包
# docker exec $POD_B_NODE tcpdump -i $CALI_B -nn -c 3 "icmp"tcpdump: verbose output suppressed, use -v[v]... for full protocol decodelistening on cali60e949dde20, link-type EN10MB (Ethernet), snapshot length 262144 bytes09:11:18.397634 IP 192.168.252.7 > 192.168.114.67: ICMP echo request, id 14, seq 905, length 6409:11:18.397655 IP 192.168.114.67 > 192.168.252.7: ICMP echo reply, id 14, seq 905, length 6409:11:19.397921 IP 192.168.252.7 > 192.168.114.67: ICMP echo request, id 14, seq 906, length 643 packets captured4 packets received by filter0 packets dropped by kernel数据包即将进入Pod B的网络命名空间。
在Pod B内部抓取接收的数据包
# kubectl debug pod/bgp-test-b -it --image=nicolaka/netshoot -- tcpdump -i eth0 -nn -c 3 "icmp"--profile=legacy is deprecated and will be removed in the future. It is recommended to explicitly specify a profile, for example "--profile=general".Defaulting debug container name to debugger-7c64v.All commands and output from this session will be recorded in container logs, including credentials and sensitive information passed through the command prompt.If you don't see a command prompt, try pressing enter.09:13:28.431744 IP 192.168.252.7 > 192.168.114.67: ICMP echo request, id 14, seq 1035, length 6409:13:28.431762 IP 192.168.114.67 > 192.168.252.7: ICMP echo reply, id 14, seq 1035, length 6409:13:29.432026 IP 192.168.252.7 > 192.168.114.67: ICMP echo request, id 14, seq 1036, length 643 packets captured4 packets received by filter0 packets dropped by kernel成功交付到Pod B。
检查BGP状态和路由表
# 查看节点A的BGP路由表# docker exec $POD_A_NODE ip route show | grep -E "bird|calico"192.168.114.64/26 via 172.18.0.8 dev eth0 proto birdblackhole 192.168.252.0/26 proto bird
# 查看节点B的BGP路由表# docker exec $POD_B_NODE ip route show | grep -E "bird|calico"blackhole 192.168.114.64/26 proto bird192.168.252.0/26 via 172.18.0.4 dev eth0 proto bird4.3.3 Calico BGP模式流量全路径抓包分析
4.3.3.1 环境信息
- Pod网络:
192.168.0.0/16(Calico默认IP池)- Pod A:
192.168.252.7(节点A) - Pod B:
192.168.114.67(节点B)
- Pod A:
- 节点网络:
172.18.0.0/16(Kind集群内部网络)- 节点A:
172.18.0.4 - 节点B:
172.18.0.8
- 节点A:
- 路由方式: BGP直接路由,无隧道封装
4.3.3.2 阶段一:Pod A内部 - 原始报文生成
06:02:26.698382 IP 192.168.252.7 > 192.168.114.67: ICMP echo request, id 14, seq 24, length 6406:02:26.698545 IP 192.168.114.67 > 192.168.252.7: ICMP echo reply, id 14, seq 24, length 6406:02:27.698671 IP 192.168.252.7 > 192.168.114.67: ICMP echo request, id 14, seq 25, length 64📊 详细分析:
- 源IP:
192.168.252.7(Pod A的IP) - 目的IP:
192.168.114.67(Pod B的IP) - 协议: ICMP (ping请求)
- TTL: 默认64(从应用层发出)
- 数据链路层: 源MAC为Pod A的eth0 MAC,目的MAC为Pod A的默认网关MAC(即cali接口的MAC)
✅ 验证点: 应用程序发起对目标Pod的访问,这是通信的绝对起点。
4.3.3.3 阶段二:节点A cali接口 - veth对端接收
08:57:55.179227 IP 192.168.252.7 > 192.168.114.67: ICMP echo request, id 14, seq 102, length 6408:57:55.179385 IP 192.168.114.67 > 192.168.252.7: ICMP echo reply, id 14, seq 102, length 6408:57:56.179458 IP 192.168.252.7 > 192.168.114.67: ICMP echo request, id 14, seq 103, length 64📊 详细分析:
- 路径: Pod A的eth0 ↔ veth pair(一端在Pod内,一端在主机)
- 报文状态: IP头部无变化,仍为原始ICMP包
- MAC地址转换: 源MAC已变为cali接口的MAC
✅ 验证点: 数据包已从Pod网络命名空间进入主机网络命名空间。
4.3.3.4 阶段三:节点A路由表查询 - BGP路由决策
192.168.114.64/26 via 172.18.0.8 dev eth0 proto bird📊 详细分析:
- BGP路由学习: 节点B通过BGP通告路由
192.168.114.64/26 via 172.18.0.8 - 路由决策流程:
- 目标IP
192.168.114.67匹配到子网192.168.114.64/26 - 下一跳:
172.18.0.8(节点B的物理IP) - 出口设备:
eth0(物理网卡)
- 目标IP
- ARP查询: 节点A需要知道
172.18.0.8的MAC地址,通过ARP获得。
✅ 验证点: BGP路由表正确工作,数据包将直接通过物理网络转发。
4.3.3.5 阶段四:节点A物理网卡 - 直接转发(无封装)
09:07:10.329848 IP (tos 0x0, ttl 63, id 1812, offset 0, flags [DF], proto ICMP (1), length 84) 192.168.252.7 > 192.168.114.67: ICMP echo request, id 14, seq 657, length 6409:07:10.329946 IP (tos 0x0, ttl 63, id 8769, offset 0, flags [none], proto ICMP (1), length 84) 192.168.114.67 > 192.168.252.7: ICMP echo reply, id 14, seq 657, length 6409:07:11.330101 IP (tos 0x0, ttl 63, id 1876, offset 0, flags [DF], proto ICMP (1), length 84) 192.168.252.7 > 192.168.114.67: ICMP echo request, id 14, seq 658, length 64📊 详细分析:
🔶 报文封装:
- 以太网帧头部:
- 源MAC: 节点A物理网卡MAC
- 目的MAC: 节点B物理网卡MAC(通过ARP获得)
- IP头部:
- 源IP:
192.168.252.7(Pod A - 保持不变) - 目的IP:
192.168.114.67(Pod B - 保持不变) - TTL: 63(减少1,经过一次路由跳转)
- 协议: ICMP (1)
- 源IP:
- 关键特征:
- 无隧道封装: 没有VXLAN/UDP头部,没有IPIP头部
- Pod IP直通: Pod IP直接在物理网络上传输
✅ 验证点: BGP模式成功实现无封装直连,物理网络上直接看到Pod IP通信。
4.3.3.6 阶段五:节点B物理网卡 - 接收与路由
09:08:00.343503 IP (tos 0x0, ttl 63, id 26778, offset 0, flags [DF], proto ICMP (1), length 84) 192.168.252.7 > 192.168.114.67: ICMP echo request, id 14, seq 707, length 6409:08:00.343569 IP (tos 0x0, ttl 63, id 33457, offset 0, flags [none], proto ICMP (1), length 84) 192.168.114.67 > 192.168.252.7: ICMP echo reply, id 14, seq 707, length 6409:08:01.343761 IP (tos 0x0, ttl 63, id 27568, offset 0, flags [DF], proto ICMP (1), length 84) 192.168.252.7 > 192.168.114.67: ICMP echo request, id 14, seq 708, length 64📊 详细分析:
- 物理网络传输:
- 底层交换机根据目的MAC将帧转发到节点B
- 内核处理:
- 节点B的eth0收到数据包,检查目的IP
192.168.114.67 - 该IP属于本地Pod网段,触发本地路由
- 节点B的eth0收到数据包,检查目的IP
- 本地路由决策:
- 查询路由表,匹配到
192.168.114.64/26 dev cali60e949dde20 scope link或类似条目
- 查询路由表,匹配到
✅ 验证点: 数据包成功到达目标节点,且未被解封装(因为本来就没有封装)。
4.3.3.7 阶段六:节点B cali接口 - 转发到Pod
09:11:18.397634 IP 192.168.252.7 > 192.168.114.67: ICMP echo request, id 14, seq 905, length 6409:11:18.397655 IP 192.168.114.67 > 192.168.252.7: ICMP echo reply, id 14, seq 905, length 6409:11:19.397921 IP 192.168.252.7 > 192.168.114.67: ICMP echo request, id 14, seq 906, length 64📊 详细分析:
- 本地转发:
- 根据路由表,数据包从eth0转发到cali接口
- MAC地址转换:
- 目的MAC设置为Pod B的eth0 MAC(通过ARP获得)
- veth传输:
- 通过cali接口(veth pair)将数据包送入Pod B的网络命名空间
✅ 验证点: 数据包在目标节点内部完成转发,即将进入Pod。
4.3.3.8 阶段七:Pod B内部 - 最终接收
09:13:28.431744 IP 192.168.252.7 > 192.168.114.67: ICMP echo request, id 14, seq 1035, length 6409:13:28.431762 IP 192.168.114.67 > 192.168.252.7: ICMP echo reply, id 14, seq 1035, length 6409:13:29.432026 IP 192.168.252.7 > 192.168.114.67: ICMP echo request, id 14, seq 1036, length 64📊 详细分析:
-
完整路径总结:
text
Pod A eth0 (192.168.252.7)↓ veth pair (cali2c3211ffbd5)↓ 路由查询 (BGP路由表)↓ 物理网卡eth0 (172.18.0.4)↓ 物理网络传输 (无封装)↓ 物理网卡eth0 (172.18.0.8)↓ 路由查询 (本地路由表)↓ veth pair (cali60e949dde20)↓ Pod B eth0 (192.168.114.67) -
端到端验证:
- IP地址: 源/目的IP全程保持不变
- TTL变化: 64 → 63 → 63(交付应用,未再减少)
- 数据完整性: ICMP序列号递增,无丢包
- 封装开销: 零封装,原始84字节ICMP包在物理网络上仍为84字节(仅增加二层以太网头部)
✅ 验证点: 跨节点Pod通信成功,全路径各环节均工作正常。
4.3.3.9 阶段八:BGP状态与路由表验证
# 节点A的BGP路由表192.168.114.64/26 via 172.18.0.8 dev eth0 proto birdblackhole 192.168.252.0/26 proto bird
# 节点B的BGP路由表blackhole 192.168.114.64/26 proto bird192.168.252.0/26 via 172.18.0.4 dev eth0 proto bird📊 详细分析:
- BGP邻居关系: Calico节点之间通过BGP协议交换路由,形成全互联或指定拓扑。
- 路由注入: 每个节点将自己负责的Pod子网通过BGP通告给其他节点。
- 内核路由表: 节点A添加了到达
192.168.114.64/26的路由,下一跳为节点B物理IP;节点B添加了到达192.168.252.0/26的路由,下一跳为节点A物理IP。 - 黑洞路由: 每个节点为自己的Pod子网添加一条blackhole路由,防止路由环路。
✅ 验证点: BGP协议工作正常,路由表与预期一致,确保后续数据包能正确转发。
第五章:Kubernetes 网络性能调优与排障实战
5.0搭建Kind集群
基于kind搭建测试集群快速创建一个可用的测试集群。
配置:
kind: ClusterapiVersion: kind.x-k8s.io/v1alpha4networking: apiServerAddress: "10.10.151.201" disableDefaultCNI: true podSubnet: "192.168.0.0/16"nodes:- role: control-plane extraPortMappings: - containerPort: 6443 hostPort: 6443 listenAddress: "10.10.151.201" protocol: tcp- role: control-plane- role: control-plane- role: worker- role: worker创建高可用集群命令:
sudo kind create cluster --config=huari.yaml --name huari-test --image kindest/node:v1.34.0 --retain; sudo kind export logs --name huari-test切换kubectl上下文:
sudo kubectl cluster-info --context kind-huari-test查看信息:
# 查看集群节点sudo kubectl get nodes
# 查看集群全部的podsudo kubectl get pods -A -owide删除集群:
sudo kind delete cluster --name huari-test5.1 部署性能测试工具
需要注意的是,kind集群配置了关闭默认cni插件。
networking: disableDefaultCNI: true所以在部署性能测试工具之前,需要部署cni插件,可以根据测试的顺序,分别参照3.1 Flannel VXLAN模式部署和4.1 部署 Calico进行flannel和calico的部署!
使用 Deployment 部署 iperf3 服务端,用 DaemonSet 部署 iperf3 客户端,这样每个节点上都有一个客户端,方便测试同节点和跨节点场景。
5.1.1 创建 iperf3 服务端 Deployment 和 Service
将以下内容保存为 iperf3-server.yaml:
apiVersion: apps/v1kind: Deploymentmetadata: name: iperf3-server namespace: defaultspec: replicas: 1 selector: matchLabels: app: iperf3-server template: metadata: labels: app: iperf3-server spec: containers: - name: iperf3 image: networkstatic/iperf3 args: ["-s"] ports: - containerPort: 5201 name: server---apiVersion: v1kind: Servicemetadata: name: iperf3-server namespace: defaultspec: selector: app: iperf3-server ports: - protocol: TCP port: 5201 targetPort: 5201部署:
kubectl apply -f iperf3-server.yaml5.1.2 创建 iperf3 客户端 DaemonSet
保存为 iperf3-clients.yaml:
apiVersion: apps/v1kind: DaemonSetmetadata: name: iperf3-clients namespace: default labels: app: iperf3-clientspec: selector: matchLabels: app: iperf3-client template: metadata: labels: app: iperf3-client spec: containers: - name: iperf3 image: networkstatic/iperf3 command: ["/bin/sh", "-c", "sleep infinity"]部署:
kubectl apply -f iperf3-clients.yaml等待所有 Pod 就绪:
kubectl get pods -l app=iperf3-clientkubectl wait --for=condition=ready pod -l app=iperf3-client --timeout=60s5.2 执行性能测试并记录基线
5.2.1 找到不同节点上的客户端 Pod
查看所有客户端 Pod 及其所在节点:
kubectl get pods -l app=iperf3-client -o wide选择一个客户端 Pod,记录其名称和所在节点。同时记录服务端 Pod 的 IP 和所在节点:
SERVER_POD=$(kubectl get pod -l app=iperf3-server -o jsonpath='{.items[0].metadata.name}')SERVER_NODE=$(kubectl get pod $SERVER_POD -o jsonpath='{.spec.nodeName}')SERVER_IP=$(kubectl get pod $SERVER_POD -o jsonpath='{.status.podIP}')echo "服务端 Pod: $SERVER_POD, 节点: $SERVER_NODE, IP: $SERVER_IP"5.2.2 测试同节点性能
找到一个与服务端同节点的客户端 Pod:
CLIENT_SAME_NODE=$(kubectl get pods -l app=iperf3-client -o json | jq -r --arg NODE "$SERVER_NODE" '.items[] | select(.spec.nodeName == $NODE) | .metadata.name')执行带宽测试:
kubectl exec $CLIENT_SAME_NODE -- iperf3 -c $SERVER_IPflannel同节点测试结果:
Connecting to host 10.244.4.2, port 5201[ 5] local 10.244.4.3 port 33904 connected to 10.244.4.2 port 5201[ ID] Interval Transfer Bitrate Retr Cwnd[ 5] 0.00-1.00 sec 5.37 GBytes 46.1 Gbits/sec 0 1.63 MBytes[ 5] 1.00-2.00 sec 5.43 GBytes 46.7 Gbits/sec 0 1.63 MBytes[ 5] 2.00-3.00 sec 5.40 GBytes 46.4 Gbits/sec 0 1.63 MBytes[ 5] 3.00-4.00 sec 5.35 GBytes 45.9 Gbits/sec 0 1.80 MBytes[ 5] 4.00-5.00 sec 5.36 GBytes 46.0 Gbits/sec 0 2.19 MBytes[ 5] 5.00-6.00 sec 5.30 GBytes 45.5 Gbits/sec 0 2.19 MBytes[ 5] 6.00-7.00 sec 5.27 GBytes 45.2 Gbits/sec 0 2.19 MBytes[ 5] 7.00-8.00 sec 5.29 GBytes 45.4 Gbits/sec 0 2.19 MBytes[ 5] 8.00-9.00 sec 5.26 GBytes 45.2 Gbits/sec 0 2.19 MBytes[ 5] 9.00-10.00 sec 5.34 GBytes 45.8 Gbits/sec 0 2.41 MBytes- - - - - - - - - - - - - - - - - - - - - - - - -[ ID] Interval Transfer Bitrate Retr[ 5] 0.00-10.00 sec 53.4 GBytes 45.8 Gbits/sec 0 sender[ 5] 0.00-10.00 sec 53.4 GBytes 45.8 Gbits/sec receiver
iperf Done.calico同节点测试结果:
Connecting to host 10.244.244.128, port 5201[ 5] local 10.244.244.129 port 38166 connected to 10.244.244.128 port 5201[ ID] Interval Transfer Bitrate Retr Cwnd[ 5] 0.00-1.00 sec 5.03 GBytes 43.2 Gbits/sec 0 911 KBytes[ 5] 1.00-2.00 sec 5.18 GBytes 44.5 Gbits/sec 0 911 KBytes[ 5] 2.00-3.00 sec 5.18 GBytes 44.5 Gbits/sec 0 3.13 MBytes[ 5] 3.00-4.00 sec 5.25 GBytes 45.1 Gbits/sec 0 3.13 MBytes[ 5] 4.00-5.00 sec 5.23 GBytes 44.9 Gbits/sec 0 3.29 MBytes[ 5] 5.00-6.00 sec 5.23 GBytes 44.9 Gbits/sec 0 3.29 MBytes[ 5] 6.00-7.00 sec 5.22 GBytes 44.9 Gbits/sec 0 3.29 MBytes[ 5] 7.00-8.00 sec 5.26 GBytes 45.2 Gbits/sec 0 3.45 MBytes[ 5] 8.00-9.00 sec 5.23 GBytes 44.9 Gbits/sec 0 3.62 MBytes[ 5] 9.00-10.00 sec 5.23 GBytes 44.9 Gbits/sec 0 3.62 MBytes- - - - - - - - - - - - - - - - - - - - - - - - -[ ID] Interval Transfer Bitrate Retr[ 5] 0.00-10.00 sec 52.0 GBytes 44.7 Gbits/sec 0 sender[ 5] 0.00-10.00 sec 52.0 GBytes 44.7 Gbits/sec receiver
iperf Done.5.2.3 测试跨节点性能
找到一个与服务端不同节点的客户端 Pod:
CLIENT_DIFF_NODE=$(kubectl get pods -l app=iperf3-client -o json | jq -r --arg NODE "$SERVER_NODE" '.items[] | select(.spec.nodeName != $NODE) | .metadata.name' | head -1)执行测试:
kubectl exec $CLIENT_DIFF_NODE -- iperf3 -c $SERVER_IPflannel跨节点测试结果:
Connecting to host 10.244.4.2, port 5201[ 5] local 10.244.3.2 port 44242 connected to 10.244.4.2 port 5201[ ID] Interval Transfer Bitrate Retr Cwnd[ 5] 0.00-1.00 sec 2.59 GBytes 22.2 Gbits/sec 0 407 KBytes[ 5] 1.00-2.00 sec 2.64 GBytes 22.7 Gbits/sec 0 552 KBytes[ 5] 2.00-3.00 sec 2.54 GBytes 21.8 Gbits/sec 0 609 KBytes[ 5] 3.00-4.00 sec 2.55 GBytes 21.9 Gbits/sec 0 609 KBytes[ 5] 4.00-5.00 sec 2.52 GBytes 21.6 Gbits/sec 0 609 KBytes[ 5] 5.00-6.00 sec 2.53 GBytes 21.8 Gbits/sec 0 609 KBytes[ 5] 6.00-7.00 sec 2.52 GBytes 21.7 Gbits/sec 0 639 KBytes[ 5] 7.00-8.00 sec 2.54 GBytes 21.8 Gbits/sec 0 639 KBytes[ 5] 8.00-9.00 sec 2.53 GBytes 21.8 Gbits/sec 0 639 KBytes[ 5] 9.00-10.00 sec 2.54 GBytes 21.8 Gbits/sec 368 1.19 MBytes- - - - - - - - - - - - - - - - - - - - - - - - -[ ID] Interval Transfer Bitrate Retr[ 5] 0.00-10.00 sec 25.5 GBytes 21.9 Gbits/sec 368 sender[ 5] 0.00-10.00 sec 25.5 GBytes 21.9 Gbits/sec receiver
iperf Done.calico同节点测试结果:
Connecting to host 10.244.244.128, port 5201[ 5] local 10.244.114.64 port 41662 connected to 10.244.244.128 port 5201[ ID] Interval Transfer Bitrate Retr Cwnd[ 5] 0.00-1.00 sec 3.35 GBytes 28.7 Gbits/sec 0 508 KBytes[ 5] 1.00-2.00 sec 3.50 GBytes 30.0 Gbits/sec 0 769 KBytes[ 5] 2.00-3.00 sec 3.51 GBytes 30.1 Gbits/sec 0 769 KBytes[ 5] 3.00-4.00 sec 3.54 GBytes 30.4 Gbits/sec 316 1.06 MBytes[ 5] 4.00-5.00 sec 3.65 GBytes 31.3 Gbits/sec 186 1.06 MBytes[ 5] 5.00-6.00 sec 3.50 GBytes 30.1 Gbits/sec 508 1.06 MBytes[ 5] 6.00-7.00 sec 3.65 GBytes 31.3 Gbits/sec 0 1.06 MBytes[ 5] 7.00-8.00 sec 3.65 GBytes 31.4 Gbits/sec 0 1.06 MBytes[ 5] 8.00-9.00 sec 3.67 GBytes 31.5 Gbits/sec 0 1.06 MBytes[ 5] 9.00-10.00 sec 3.66 GBytes 31.5 Gbits/sec 93 1.06 MBytes- - - - - - - - - - - - - - - - - - - - - - - - -[ ID] Interval Transfer Bitrate Retr[ 5] 0.00-10.00 sec 35.7 GBytes 30.6 Gbits/sec 1103 sender[ 5] 0.00-10.00 sec 35.7 GBytes 30.6 Gbits/sec receiver
iperf Done.5.2.4 汇总基线数据表格
根据5.2节的测试结果,将不同CNI插件(flannel和calico)在同节点和跨节点场景下的网络性能数据汇总如下。测试环境为Kind集群,其中flannel采用VXLAN模式(Overlay),calico采用BGP模式(Underlay)。测试工具为iperf3,测试时长为10秒,记录的平均带宽(Bitrate)和重传次数(Retr)均为最终统计值。
| CNI插件 | 测试类型 | 带宽 (Gbits/sec) | 重传次数 |
|---|---|---|---|
| flannel | 同节点 | 45.8 | 0 |
| calico | 同节点 | 44.7 | 0 |
| flannel | 跨节点 | 21.9 | 368 |
| calico | 跨节点 | 30.6 | 1103 |
说明:
- 同节点测试:两个CNI插件的带宽均接近物理网络上限(约45 Gbits/sec),且无重传。这是因为同节点内的容器通信通过主机内核转发(如veth pair、bridge等),不经过网络封装,性能损耗极小。
- 跨节点测试:
- flannel(VXLAN Overlay):带宽为21.9 Gbits/sec,约为同节点的一半,重传368次。VXLAN模式在跨节点通信时需要对原始数据包进行UDP封装(加50字节头),消耗额外CPU资源并可能受MTU限制,导致吞吐量下降。重传较少表明网络相对稳定,但封装开销明显影响带宽。
- calico(BGP Underlay):带宽为30.6 Gbits/sec,显著高于flannel,但重传次数高达1103次。Underlay模式利用BGP路由直接将容器网络路由到物理网络,无封装开销,因此带宽更高。但较高的重传可能源于网络路径中的拥塞、路由收敛问题或测试环境中的物理网络配置(如交换机策略、队列管理等),需要进一步排查。
针对calico bgp的underlay网络重传高,个人猜测与可能与Kind的容器化环境有关(需要有机会在非Kind集群进行下测试):
- Kind网络模型:每个节点运行在Docker容器中,节点间通过Docker网桥连接,并经过宿主机的iptables和路由转发。这种额外的网络层可能引入丢包、抖动或MTU问题(如Docker网桥默认MTU为1500,而BGP依赖物理链路MTU,可能导致分片)。
- Calico BGP的特性:BGP依赖稳定的三层路由,对网络质量敏感。Kind环境的软中断竞争、连接跟踪(conntrack)规则、BGP会话短暂中断等均可能触发TCP重传。
- 与Flannel VXLAN的对比:VXLAN通过UDP封装,避开了部分Docker网桥的复杂性(如conntrack对TCP的影响),同时主动降低MTU避免分片,因此在Kind中表现更稳定,重传较少。
因此,高重传更可能是Kind环境的“副作用”,而非Calico本身的问题。建议在物理机或云主机上重新测试以获取真实性能基线。:
5.3 压力测试:模拟 conntrack 瓶颈
5.3.1 创建 Nginx 测试服务
为了产生大量 HTTP 短连接,部署一个 Nginx Deployment 和 Service:
apiVersion: apps/v1kind: Deploymentmetadata: name: nginx-testspec: replicas: 1 selector: matchLabels: app: nginx-test template: metadata: labels: app: nginx-test spec: containers: - name: nginx image: nginx---apiVersion: v1kind: Servicemetadata: name: nginx-testspec: selector: app: nginx-test ports: - port: 80部署:
kubectl apply -f nginx-test.yaml5.3.2 在客户端 Pod 中安装压测工具
选择一个客户端 Pod(例如跨节点的那个),进入容器安装 ab:
SERVER_POD=$(kubectl get pod -l app=iperf3-server -o jsonpath='{.items[0].metadata.name}')SERVER_NODE=$(kubectl get pod $SERVER_POD -o jsonpath='{.spec.nodeName}')SERVER_IP=$(kubectl get pod $SERVER_POD -o jsonpath='{.status.podIP}')echo "服务端 Pod: $SERVER_POD, 节点: $SERVER_NODE, IP: $SERVER_IP"
CLIENT_DIFF_NODE=$(kubectl get pods -l app=iperf3-client -o json | jq -r --arg NODE "$SERVER_NODE" '.items[] | select(.spec.nodeName != $NODE) | .metadata.name' | head -1)
kubectl exec -it $CLIENT_DIFF_NODE -- apt update && apt install apache2-utils -y5.3.3 执行高并发压测
发起 10000 个请求,并发 200:
kubectl exec $CLIENT_DIFF_NODE -- ab -n 10000 -c 200 http://nginx-test/结果:
This is ApacheBench, Version 2.3 <$Revision: 1923142 $>Copyright 1996 Adam Twiss, Zeus Technology Ltd, http://www.zeustech.net/Licensed to The Apache Software Foundation, http://www.apache.org/
Benchmarking nginx-test (be patient)Completed 1000 requestsCompleted 2000 requestsCompleted 3000 requestsCompleted 4000 requestsCompleted 5000 requestsCompleted 6000 requestsCompleted 7000 requestsCompleted 8000 requestsCompleted 9000 requestsCompleted 10000 requestsFinished 10000 requests
Server Software: nginx/1.29.5Server Hostname: nginx-testServer Port: 80
Document Path: /Document Length: 615 bytes
Concurrency Level: 200Time taken for tests: 0.929 secondsComplete requests: 10000Failed requests: 0Total transferred: 8480000 bytesHTML transferred: 6150000 bytesRequests per second: 10766.35 [#/sec] (mean)Time per request: 18.576 [ms] (mean)Time per request: 0.093 [ms] (mean, across all concurrent requests)Transfer rate: 8915.88 [Kbytes/sec] received
Connection Times (ms) min mean[+/-sd] median maxConnect: 0 8 2.5 8 36Processing: 2 10 2.0 9 44Waiting: 0 7 2.2 6 19Total: 11 18 2.7 18 45
Percentage of the requests served within a certain time (ms) 50% 18 66% 18 75% 18 80% 19 90% 19 95% 20 98% 26 99% 32 100% 45 (longest request)5.3.4 观察 conntrack 表:
# 查看nginx pod调度到的节点名NGINX_POD_NODE=$(kubectl get pod -l app=nginx-test -o jsonpath='{.items[0].spec.nodeName}')
# 登录到 Nginx Pod 所在节点docker exec -it $NGINX_POD_NODE sh
# 实时监控 conntrack 条目数watch -n 1 'conntrack -L | wc -l'
# 查看系统限制sysctl net.netfilter.nf_conntrack_max
# 查看是否丢包dmesg -T | grep "nf_conntrack: table full"如果 conntrack 表满,会出现丢包。
5.4 用 KubeSkoop 可视化网络路径
这里仅作简单的部署指引,具体的使用可以参照官方文档自行研究:https://kubeskoop.io/zh/docs/intro
5.4.1 部署 KubeSkoop
KubeSkoop 官方提供了两种安装方式,它们的设计目标和适用场景是分开的:
- Helm 安装:这种方式被官方称为 “生产就绪(production-ready)”安装-1。它只安装 KubeSkoop 自身的核心组件(Agent、Controller、WebConsole),不包含 Prometheus、Grafana 或 Loki。这样设计是为了让用户在现有监控体系的基础上进行集成,你可以自由配置 KubeSkoop 连接你已有的或自建的 Prometheus。
skoopbundle.yaml快速部署:这种方式会一次性部署包含 Prometheus、Grafana 和 Loki 在内的完整套件,让你可以开箱即用地体验所有功能。但官方文档明确标注,这种模式仅用于快速体验,不适合生产环境,因为它以最小配置启动所有组件,且未考虑持久化存储、高可用等生产级要求。
5.4.1.1 helm 安装
参考官方文档:https://kubeskoop.io/zh/docs/getting-started/installation
# 添加kubeskoop repohelm repo add kubeskoop https://kubeskoop.io/# 更新helm repohelm repo update# 安装kubeskoophelm install -n kubeskoop kubeskoop kubeskoop/kubeskoop --create-namespace# 请将下面的地址替换为你实际的Prometheus服务地址helm upgrade -n kubeskoop kubeskoop kubeskoop/kubeskoop \ --set controller.config.prometheusEndpoint="http://prometheus-operated.monitoring.svc.cluster.local:9090"这种方式适合在已经部署了Prometheus的集群里进行,或者指定外部的Prometheus也可以
5.4.1.2 skoopbundle.yaml 快速部署
参考官方文档:https://kubeskoop.io/zh/docs/quick-start
kubectl apply -f https://raw.githubusercontent.com/alibaba/kubeskoop/main/deploy/skoopbundle.yaml5.4.2 访问 控制台
端口转发:
kubectl port-forward -n kubeskoop svc/webconsole --address 0.0.0.0 8080:80浏览器打开 http://localhost:8080,默认用户名密码 admin/kubeskoop。
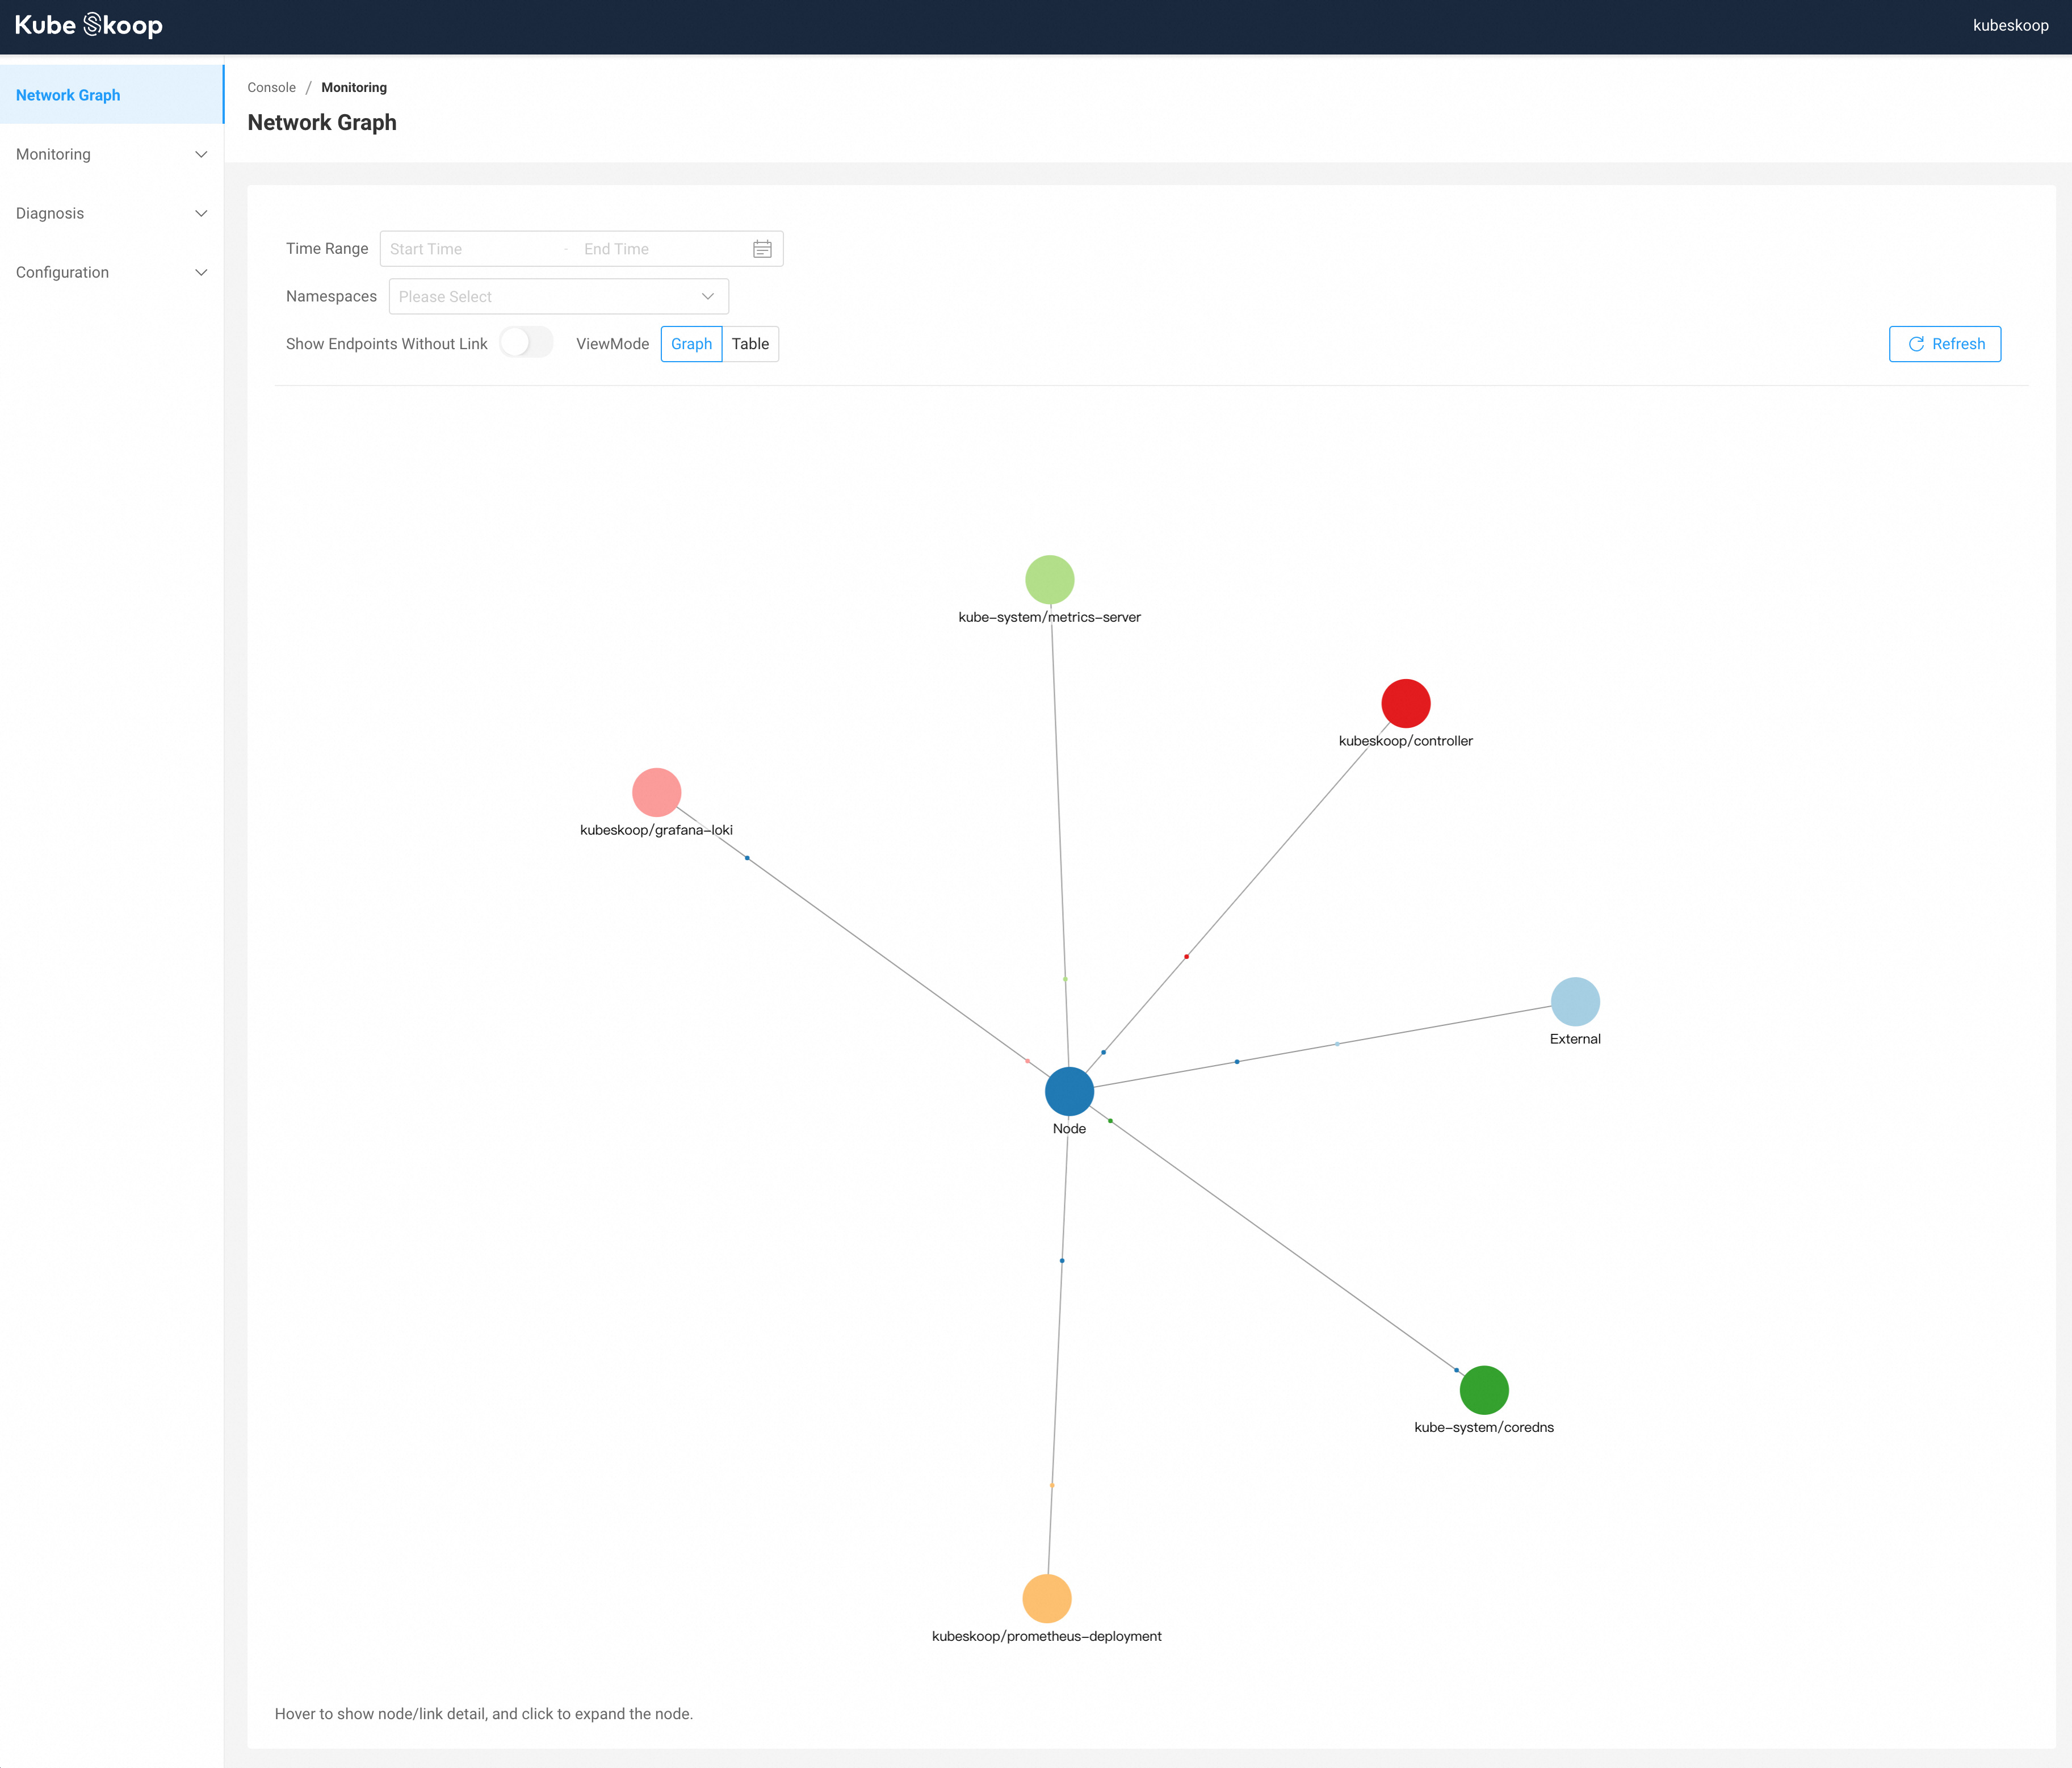
部分信息可能已经过时